Blackpool house prices have risen more than the average in the North West, new data shows
and live on Freeview channel 276
The rise contributes to the longer-term trend, which has seen property prices in the area grow by 2.6% over the last year.
The average Blackpool house price in June was £134,882, Land Registry figures show – a 2.4% increase on May.
Advertisement
Hide AdAdvertisement
Hide AdOver the month, the picture was different to that across the North West, where prices increased 1.2%, and Blackpool was above the 0.7% rise for the UK as a whole.

Over the last year, the average sale price of property in Blackpool rose by £3,400 – putting the area 26th among the North West’s 35 local authorities with price data for annual growth.
Wyre and Fylde house prices
In Wyre, however, house prices remained steady in in June, the data shows.
The lack of movement maintains the longer-term trend, which has seen property prices in the area grow by 0.1% over the last year.
Advertisement
Hide AdAdvertisement
Hide AdThe average Wyre house price in June was £191,081, Land Registry figures show – largely unchanged from May.
Over the month, the picture was different to that across the North West, where prices increased 1.2%, and Wyre was lower than the 0.7% rise for the UK as a whole.
House prices dropped by 1.1% in Fylde in June, new figures show.
But the drop does not reverse the longer-term trend, which has seen property prices in the area grow by 7.5% over the last year.
Advertisement
Hide AdAdvertisement
Hide AdThe average Fylde house price in June was £241,662, Land Registry figures show – a 1.1% decrease on May.
Over the month, the picture was different to that across the North West, where prices increased 1.2%, and Fylde was lower than the 0.7% rise for the UK as a whole.
Over the last year, the average sale price of property in Fylde rose by £17,000 – putting the area third among the North West’s 35 local authorities with price data for annual growth.
The highest annual growth in the region was in Rossendale, where property prices increased on average by 9.2%, to £201,000. At the other end of the scale, properties in Hyndburn lost 3.7% of their value, giving an average price of £118,000.
First steps on property ladder In Blackpool
Advertisement
Hide AdAdvertisement
Hide AdFirst-time buyers in Blackpool spent an average of £119,700 on their property – £2,800 more than a year ago, and £29,300 more than in June 2018.
By comparison, former owner-occupiers paid £145,800 on average in June – 21.8% more than first-time buyers.
Property types
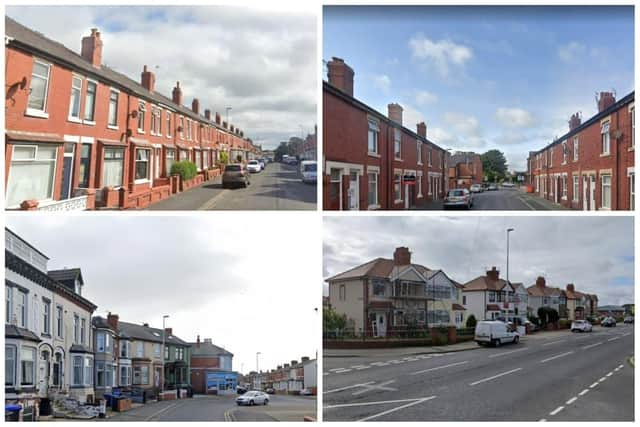
Owners of terraced houses saw the biggest rise in property prices in Blackpool in June – they increased 2.6%, to £114,017 on average. Over the last year, prices rose by 1.8%.
Among other types of property:
Detached: up 2% monthly; up 2.8% annually; £228,788 average
Semi-detached: up 2.3% monthly; up 3.2% annually; £154,770 average
Flats: up 2.5% monthly; up 2.1% annually; £80,341 average
How do property prices in Blackpool compare?
Advertisement
Hide AdAdvertisement
Hide AdBuyers paid 37.4% less than the average price in the North West (£216,000) in June for a property in Blackpool. Across the North West, property prices are low compared to those across the UK, where the average cost is £288,000.
The most expensive properties in the North West were in Trafford – £362,000 on average, and 2.7 times the price as in Blackpool. Trafford properties cost 3.1 times the price as homes in Burnley (£117,000 average), at the other end of the scale.
The highest property prices across the UK were in Kensington and Chelsea, with an average price of £1.3 million.
Factfile
Average property price in June
Blackpool: £134,882
The North West: £215,631
UK: £287,546
Annual growth to June
Blackpool: +2.6%
The North West: +3.5%
UK: +1.7%
Highest and lowest annual growth in the North West
Rossendale: +9.2%
Hyndburn: -3.7%